Image Compression Test: JPG vs WebP Quality and File Size
How much can image compression reduce file size? We tested JPG and WebP at quality levels of 90, 80, and 70 using three different images to see how the results change.
How we performed the test
We used three different test images representing a photograph, a user-interface screenshot, and a graphic. Each source image was converted to JPG and WebP using the same quality settings. The image dimensions were kept unchanged.
Test conditions
- JPG quality: 90, 80, and 70
- WebP quality: 90, 80, and 70
- Original image dimensions were preserved
- No resizing was performed
- File size was measured after encoding
These results are specific to our test images and encoding settings. They are not universal benchmarks. Different images, dimensions, encoders, and settings can produce different results.
Quick results
| Image | JPG Q70 | JPG Q80 | JPG Q90 | WebP Q70 | WebP Q80 | WebP Q90 |
|---|---|---|---|---|---|---|
| Landscape | 204.5 KB | 288.8 KB | 540.8 KB | 57.2 KB | 141.7 KB | 469.1 KB |
| UI Screenshot | 76.0 KB | 86.0 KB | 106.5 KB | 17.8 KB | 20.2 KB | 26.4 KB |
| Graphic | 67.0 KB | 74.2 KB | 89.9 KB | 12.6 KB | 14.6 KB | 17.4 KB |
Landscape compression test
A 1920 × 1280 landscape-style image with gradients, mountains, vegetation, water, and varied visual detail.
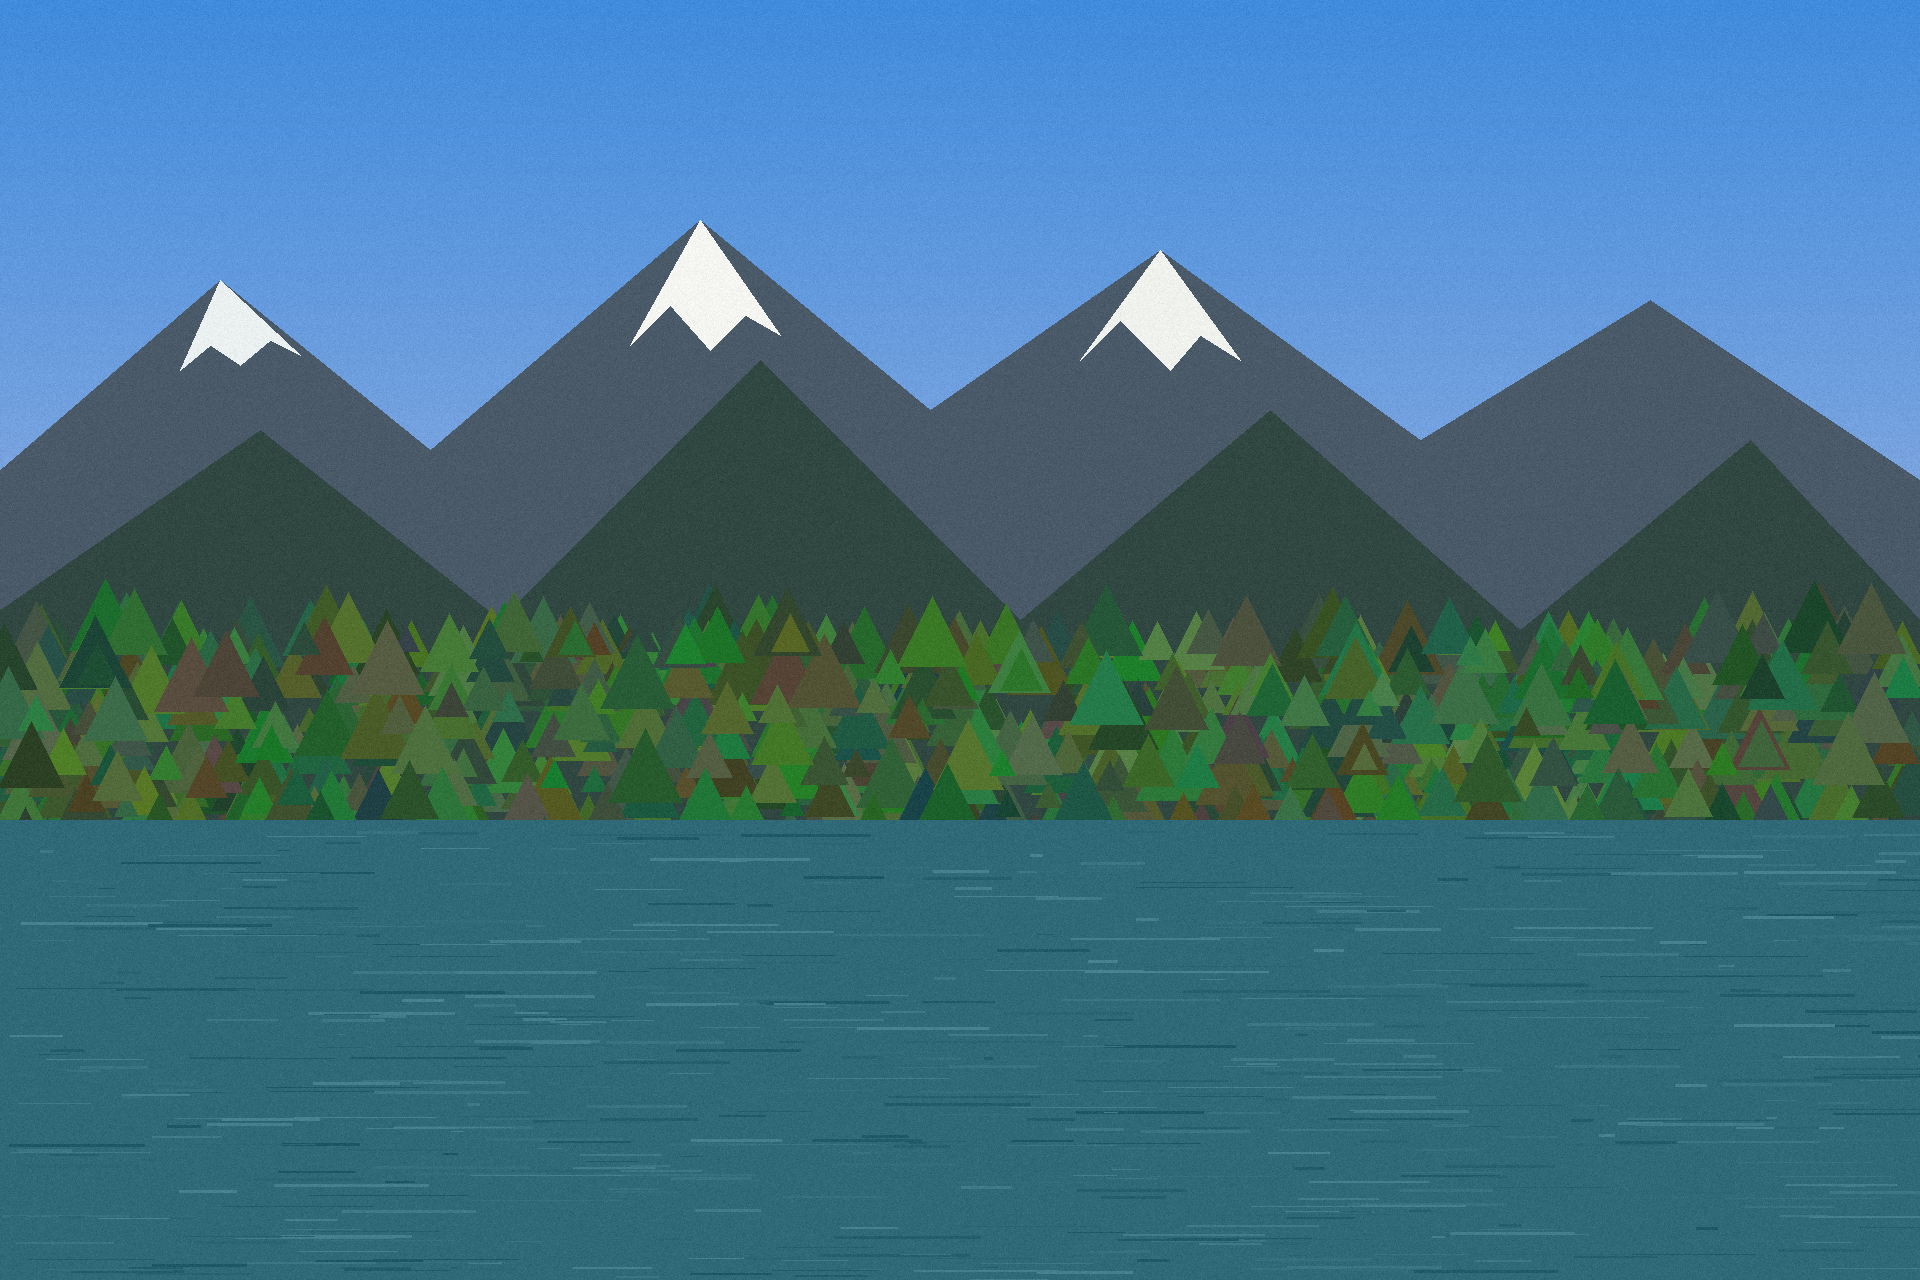
Original
Source image
JPG results
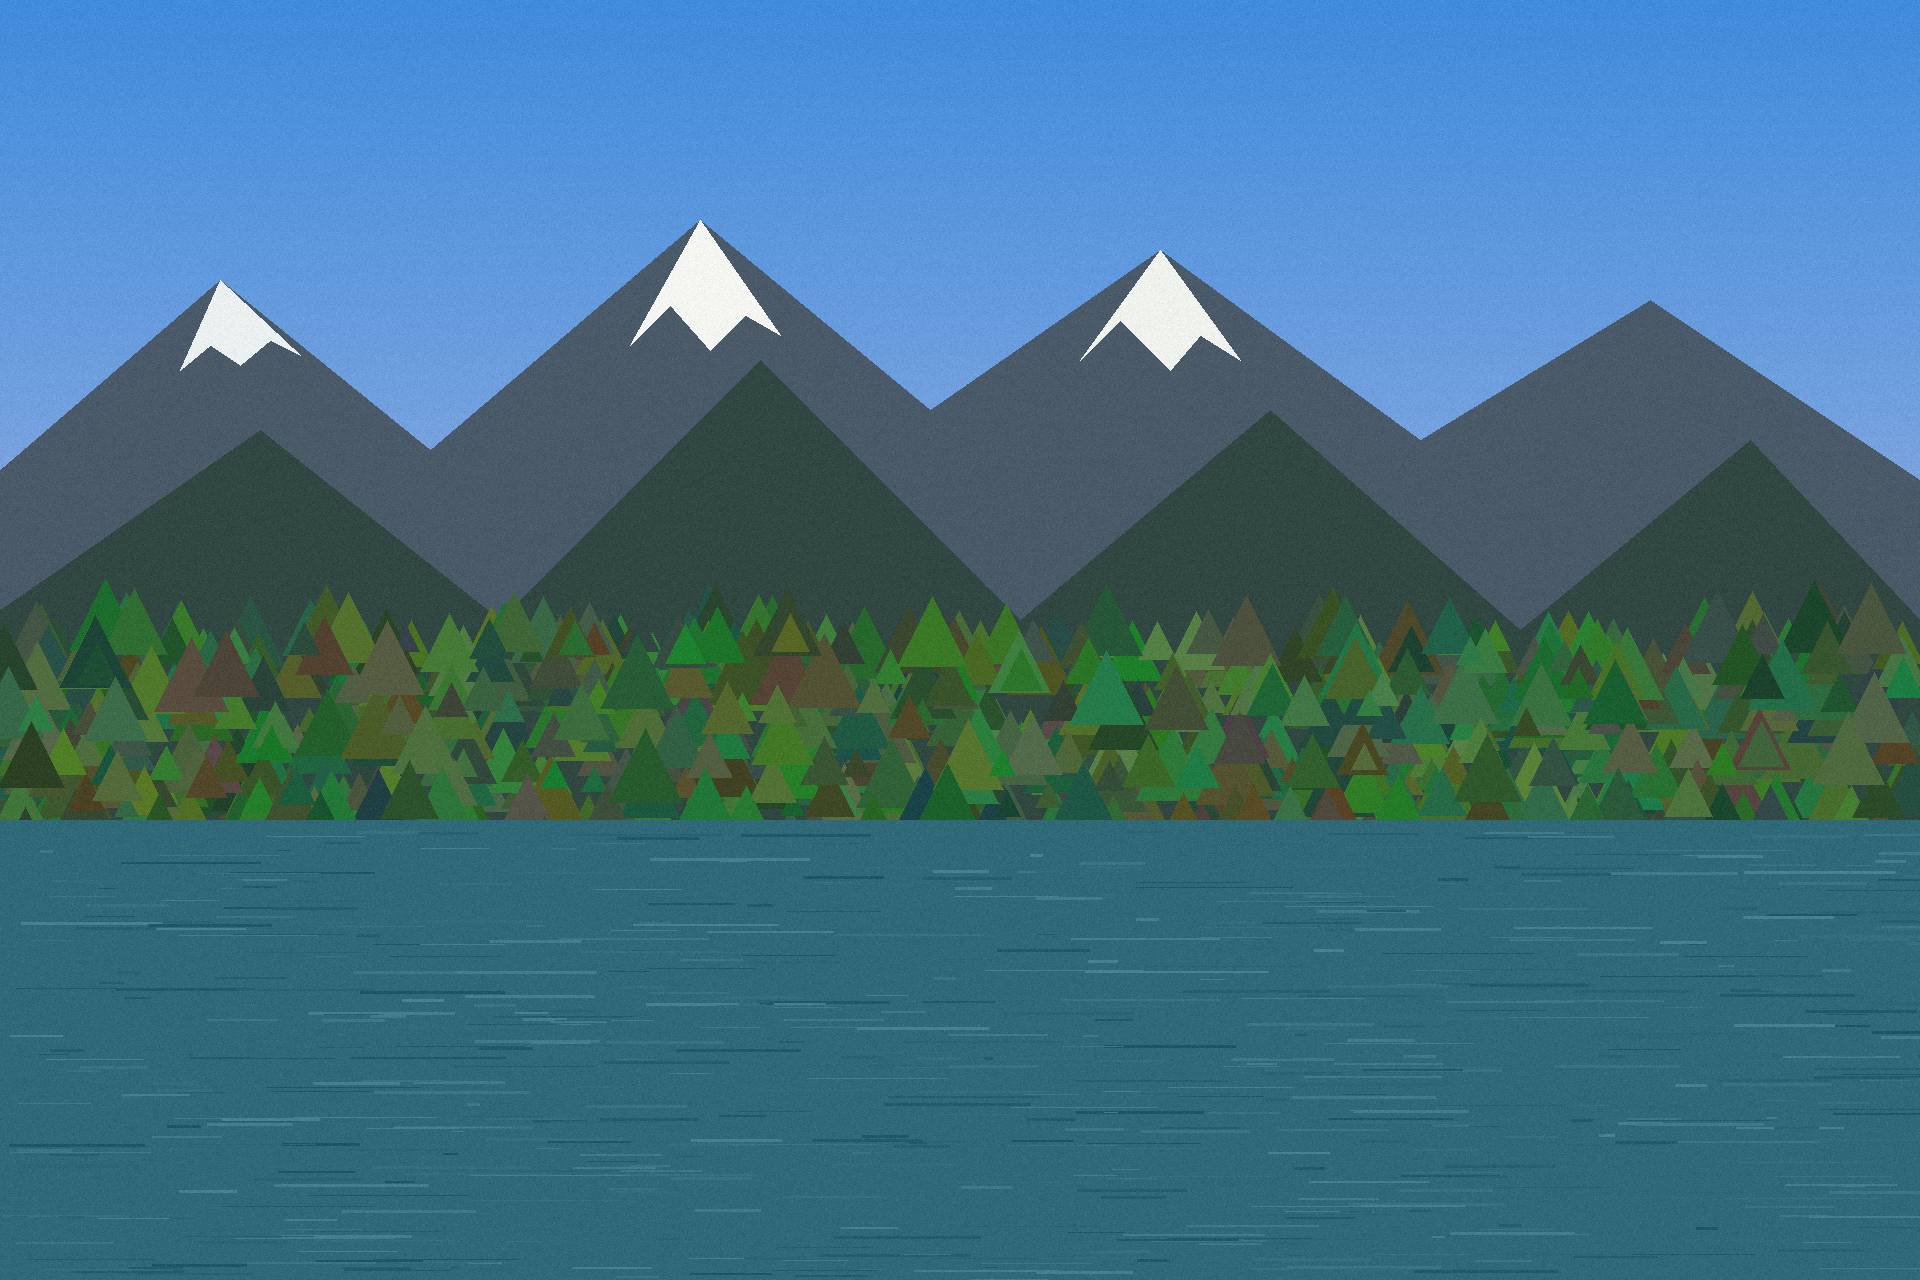
JPG Q70
204.5 KB
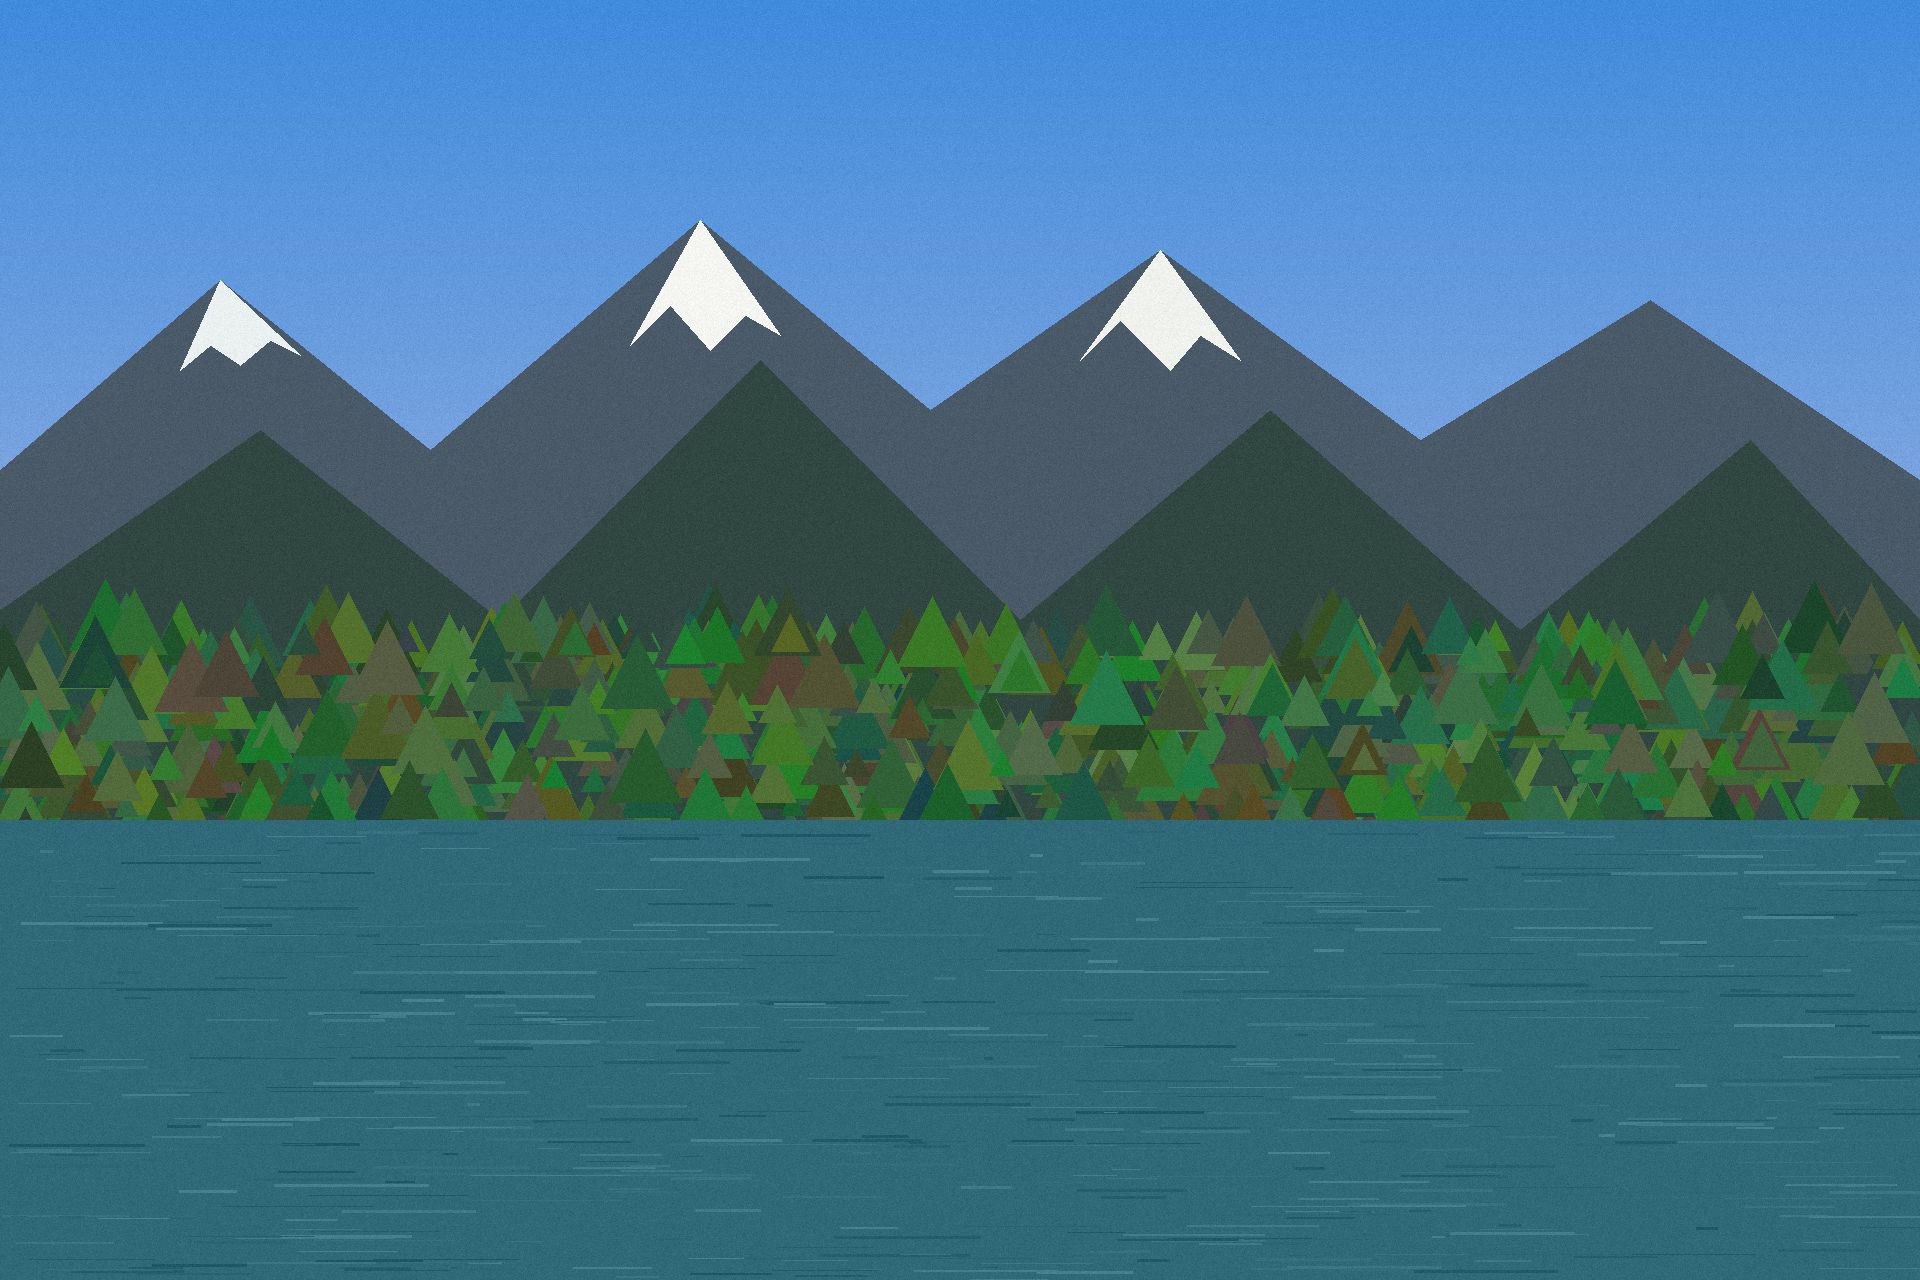
JPG Q80
288.8 KB
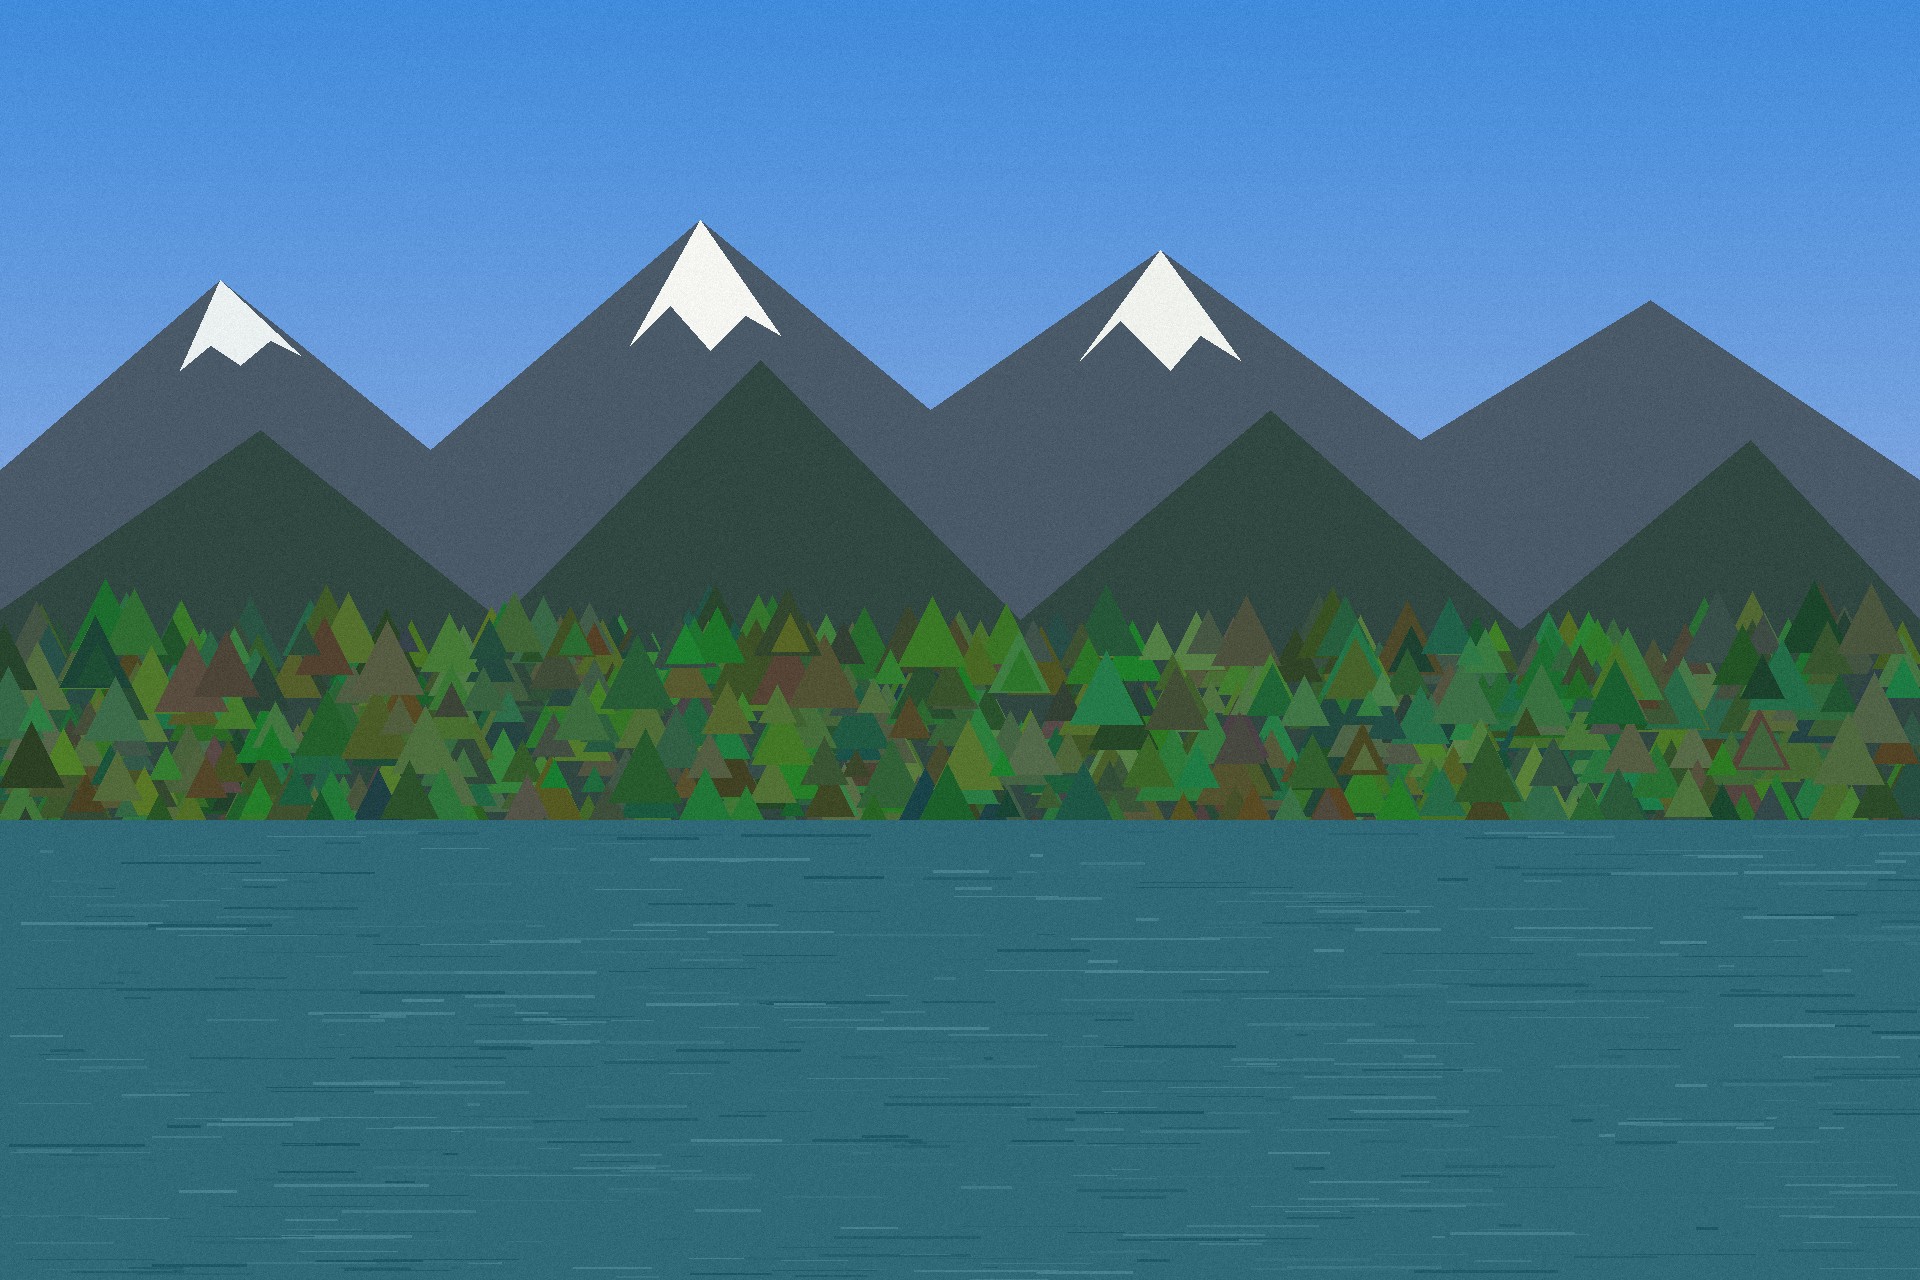
JPG Q90
540.8 KB
WebP results
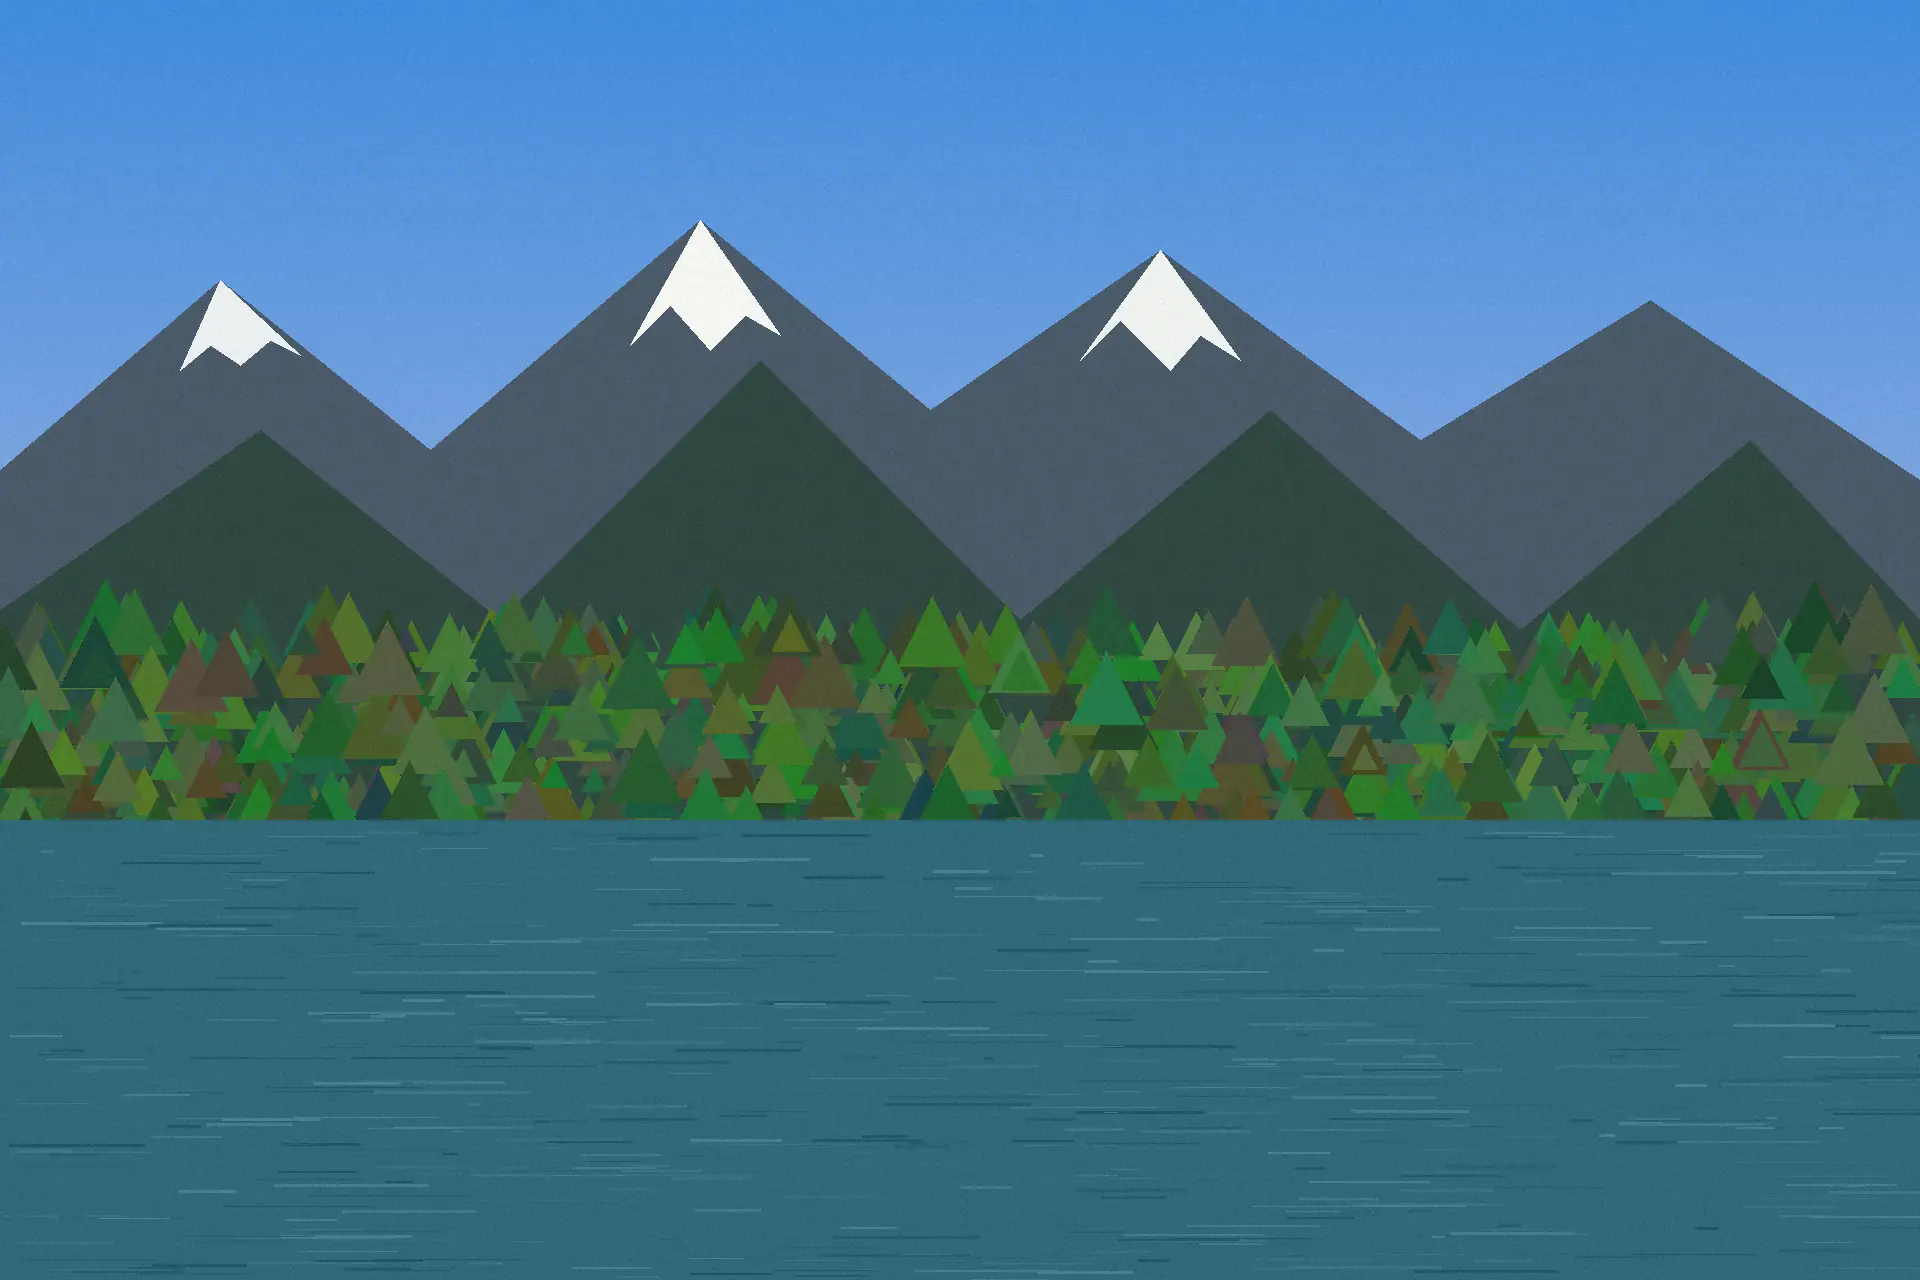
WebP Q70
57.2 KB
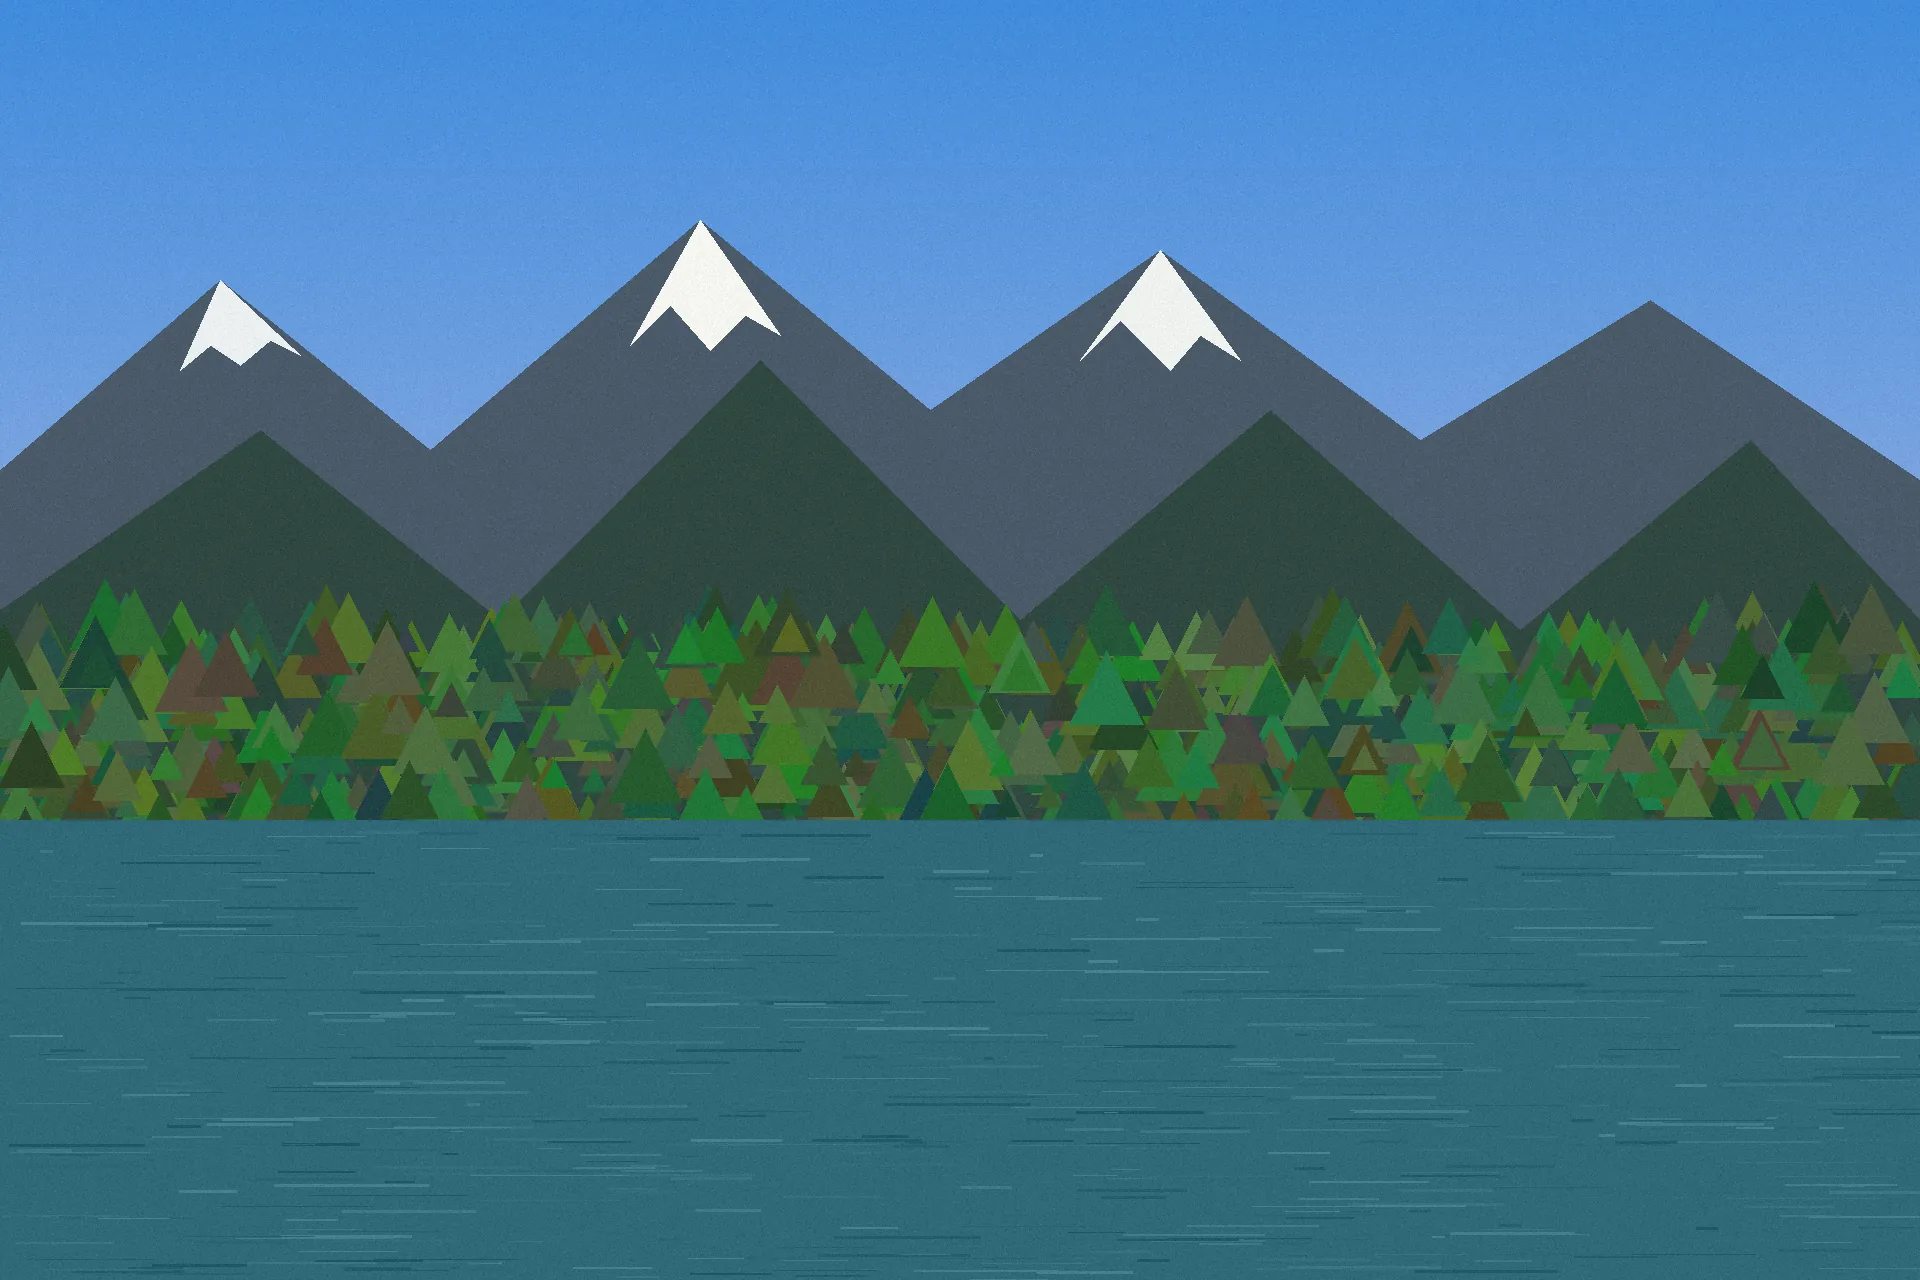
WebP Q80
141.7 KB
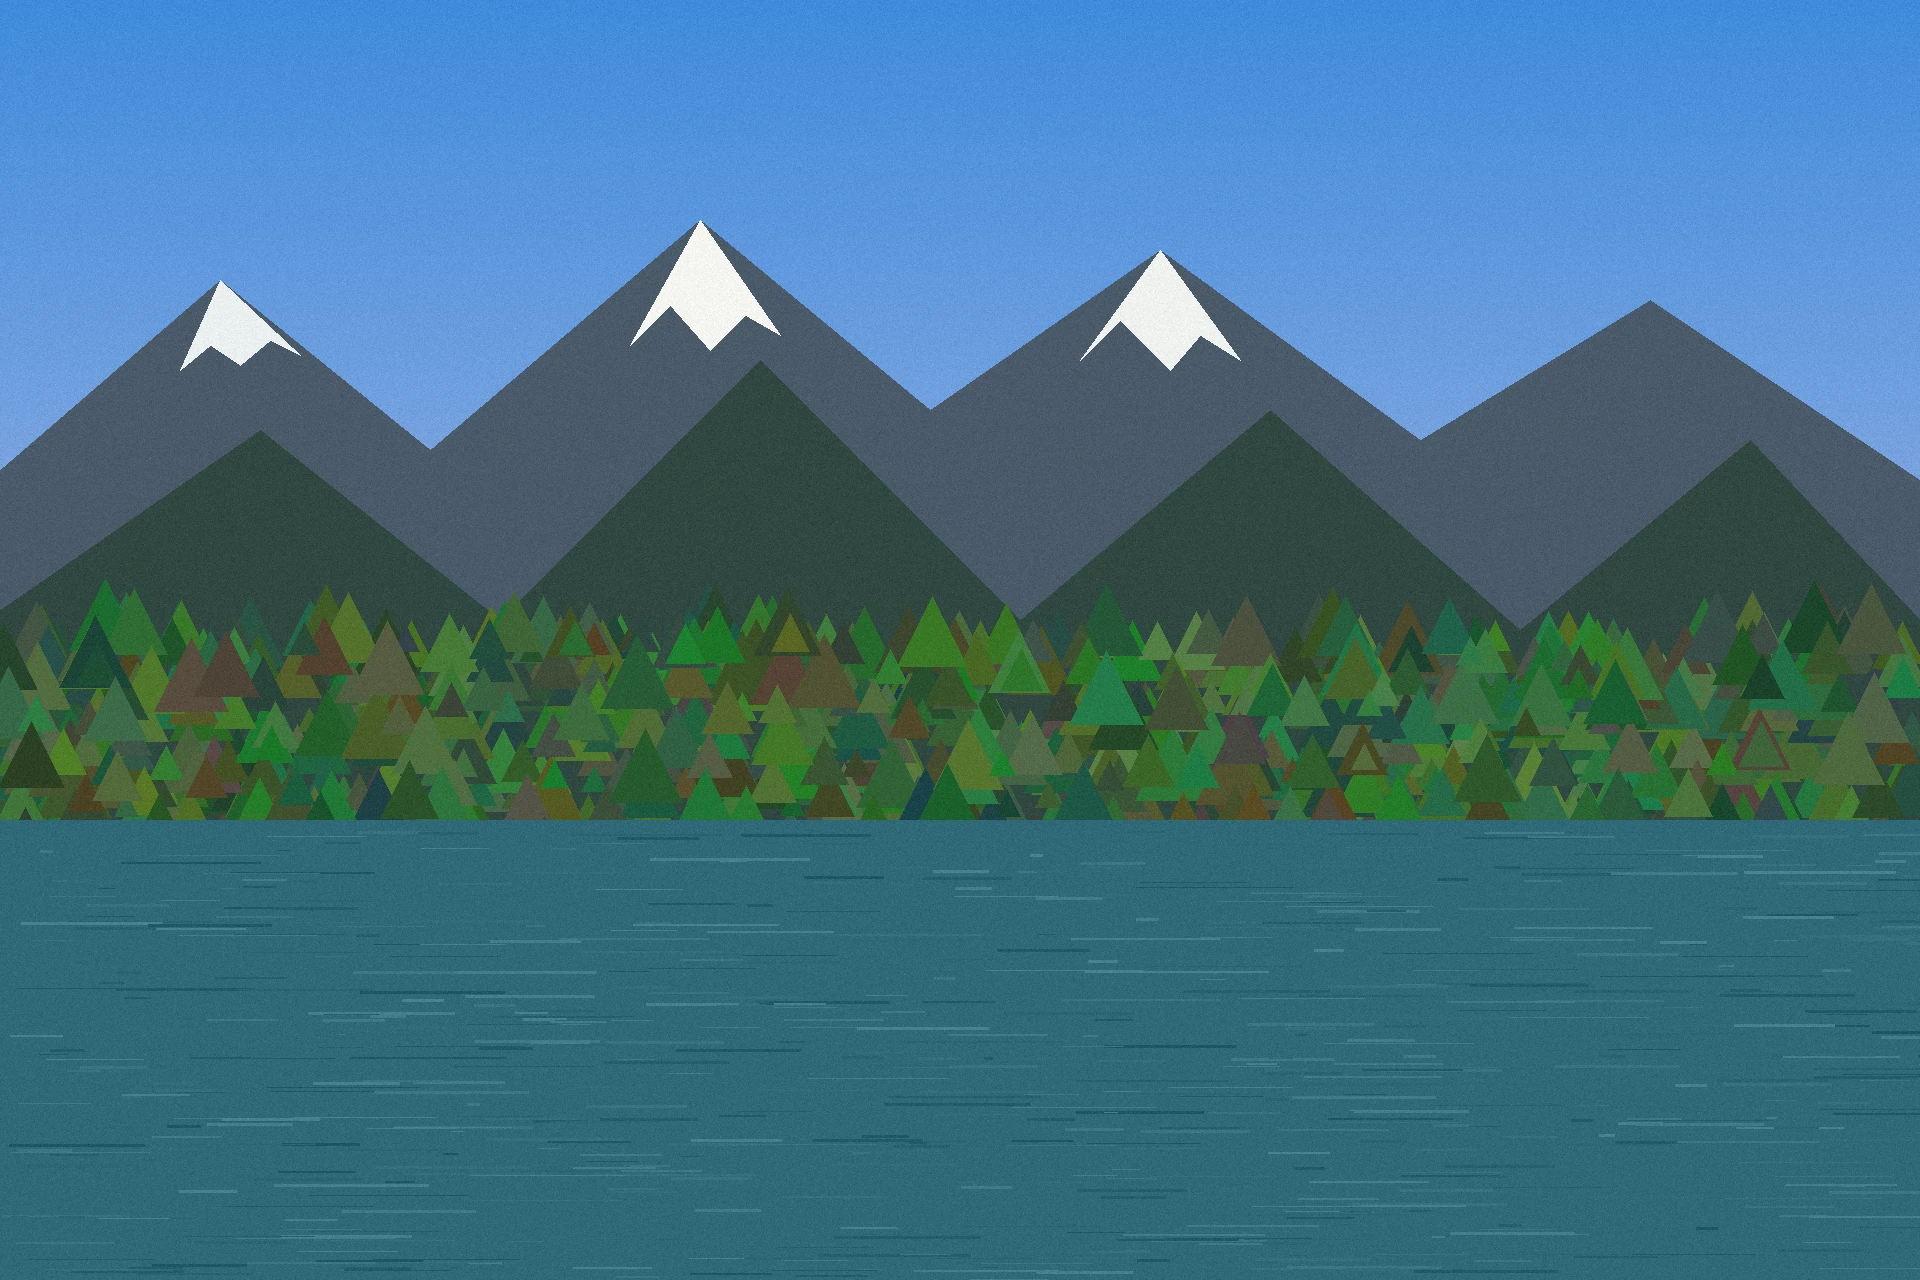
WebP Q90
469.1 KB
What happened?
Lowering the quality setting generally reduced the file size. However, the amount of reduction varied considerably between image types. The landscape image showed much larger changes in file size than the screenshot and graphic tests.
UI Screenshot compression test
A 1920 × 1080 interface-style image containing large areas of solid color, charts, lines, and sharp graphical elements.
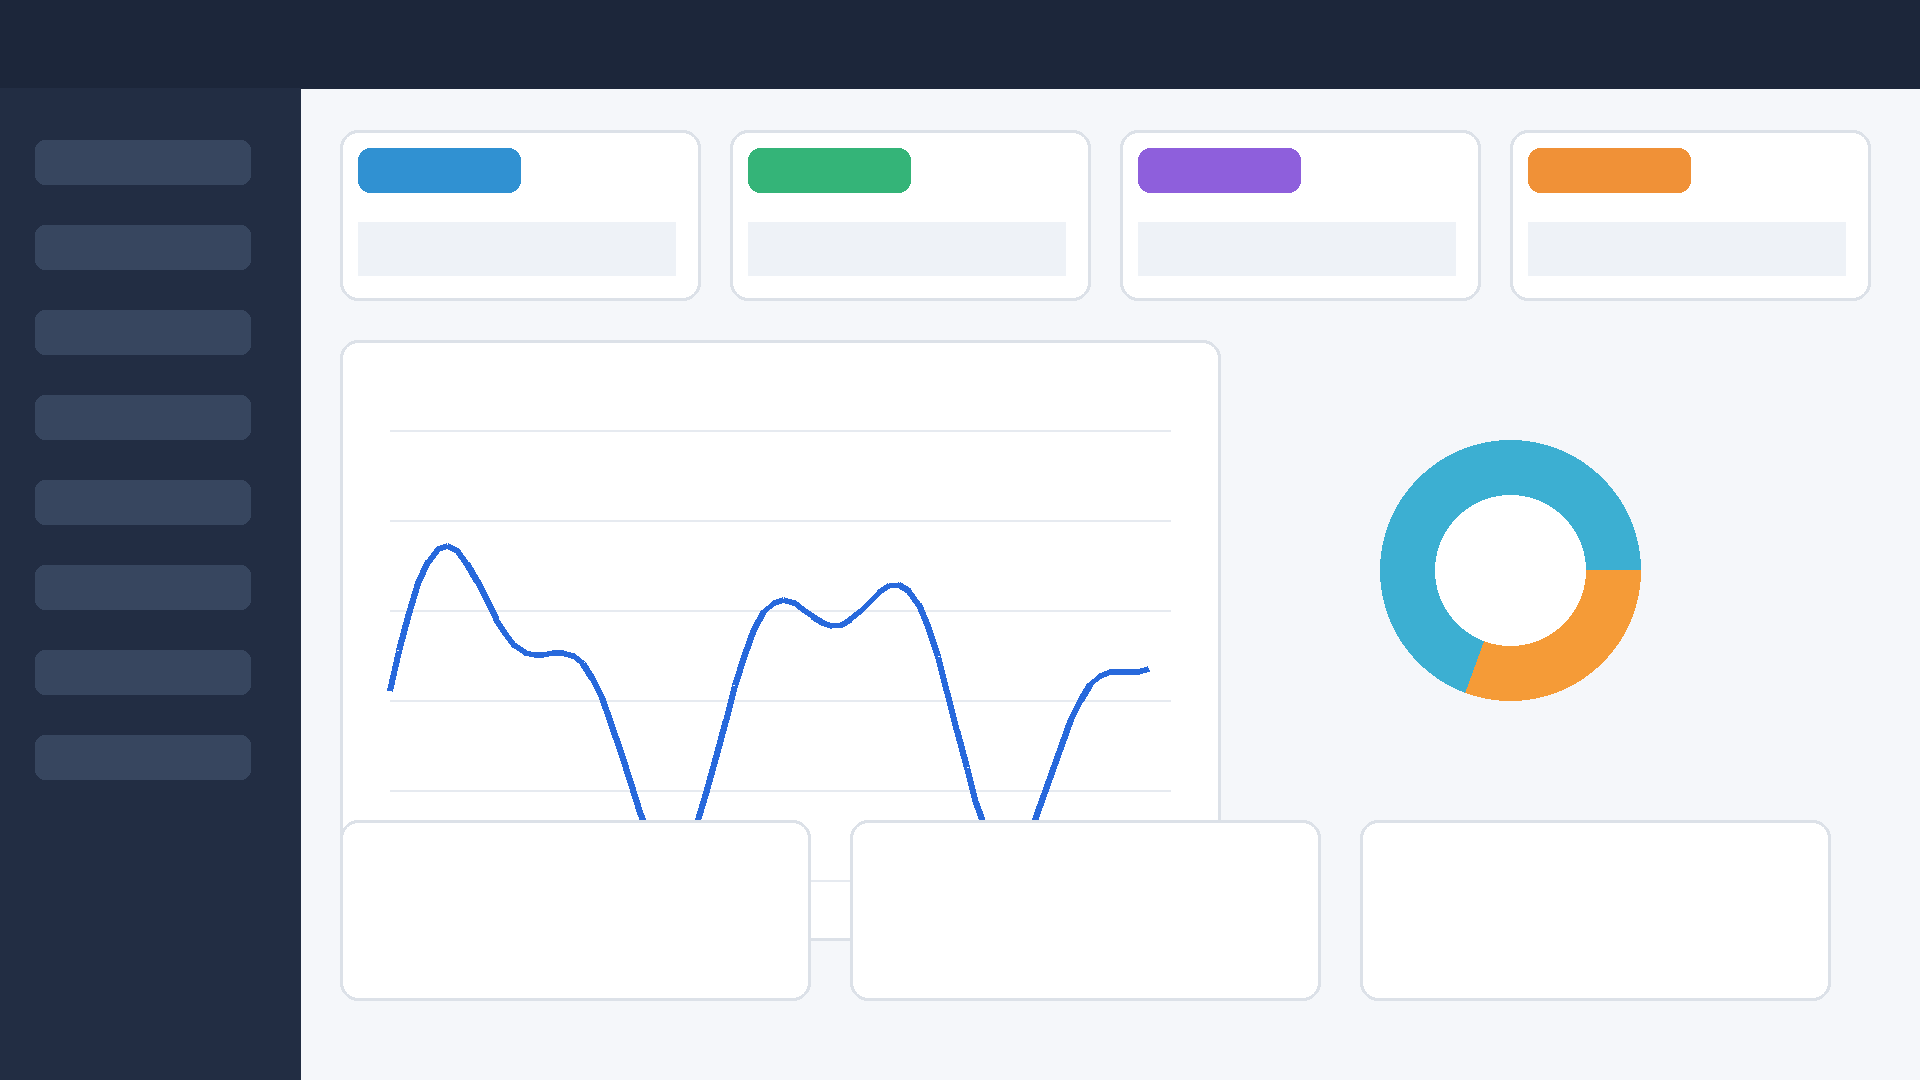
Original
Source image
JPG results
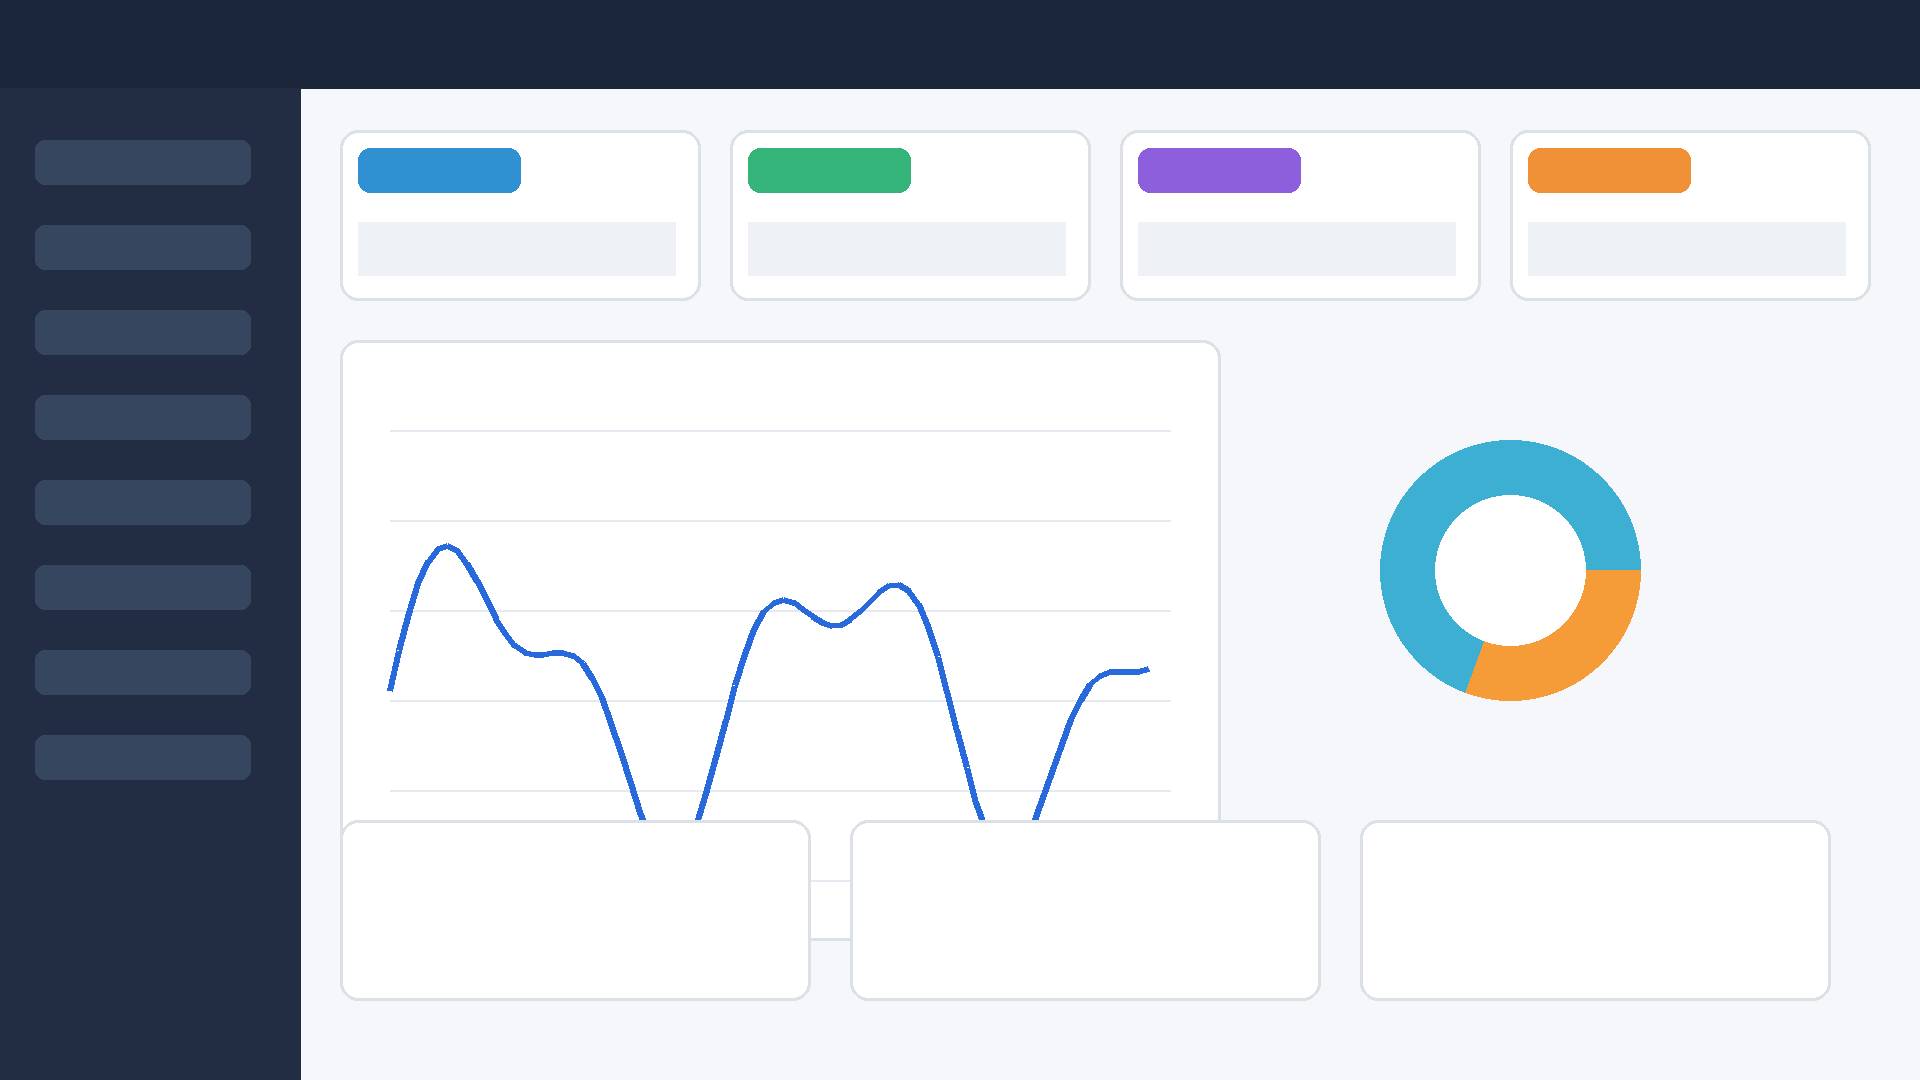
JPG Q70
76.0 KB
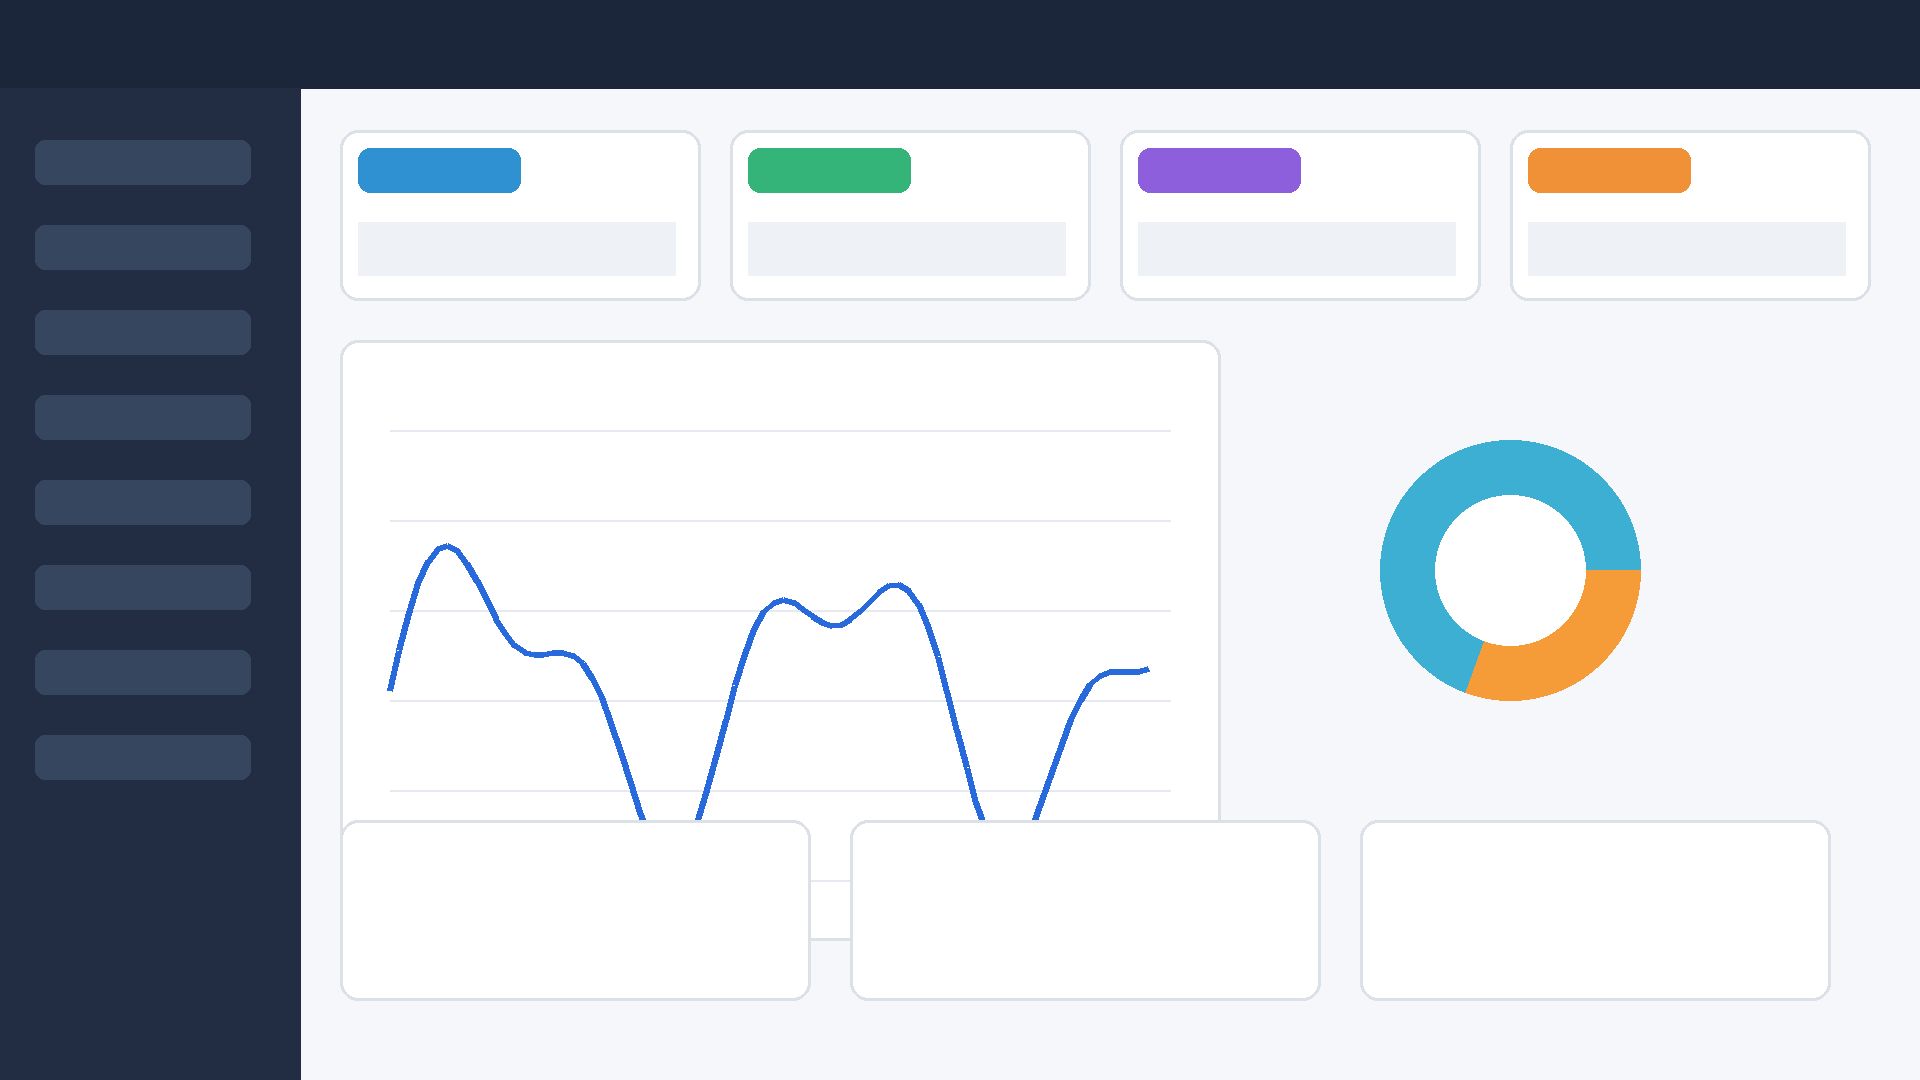
JPG Q80
86.0 KB
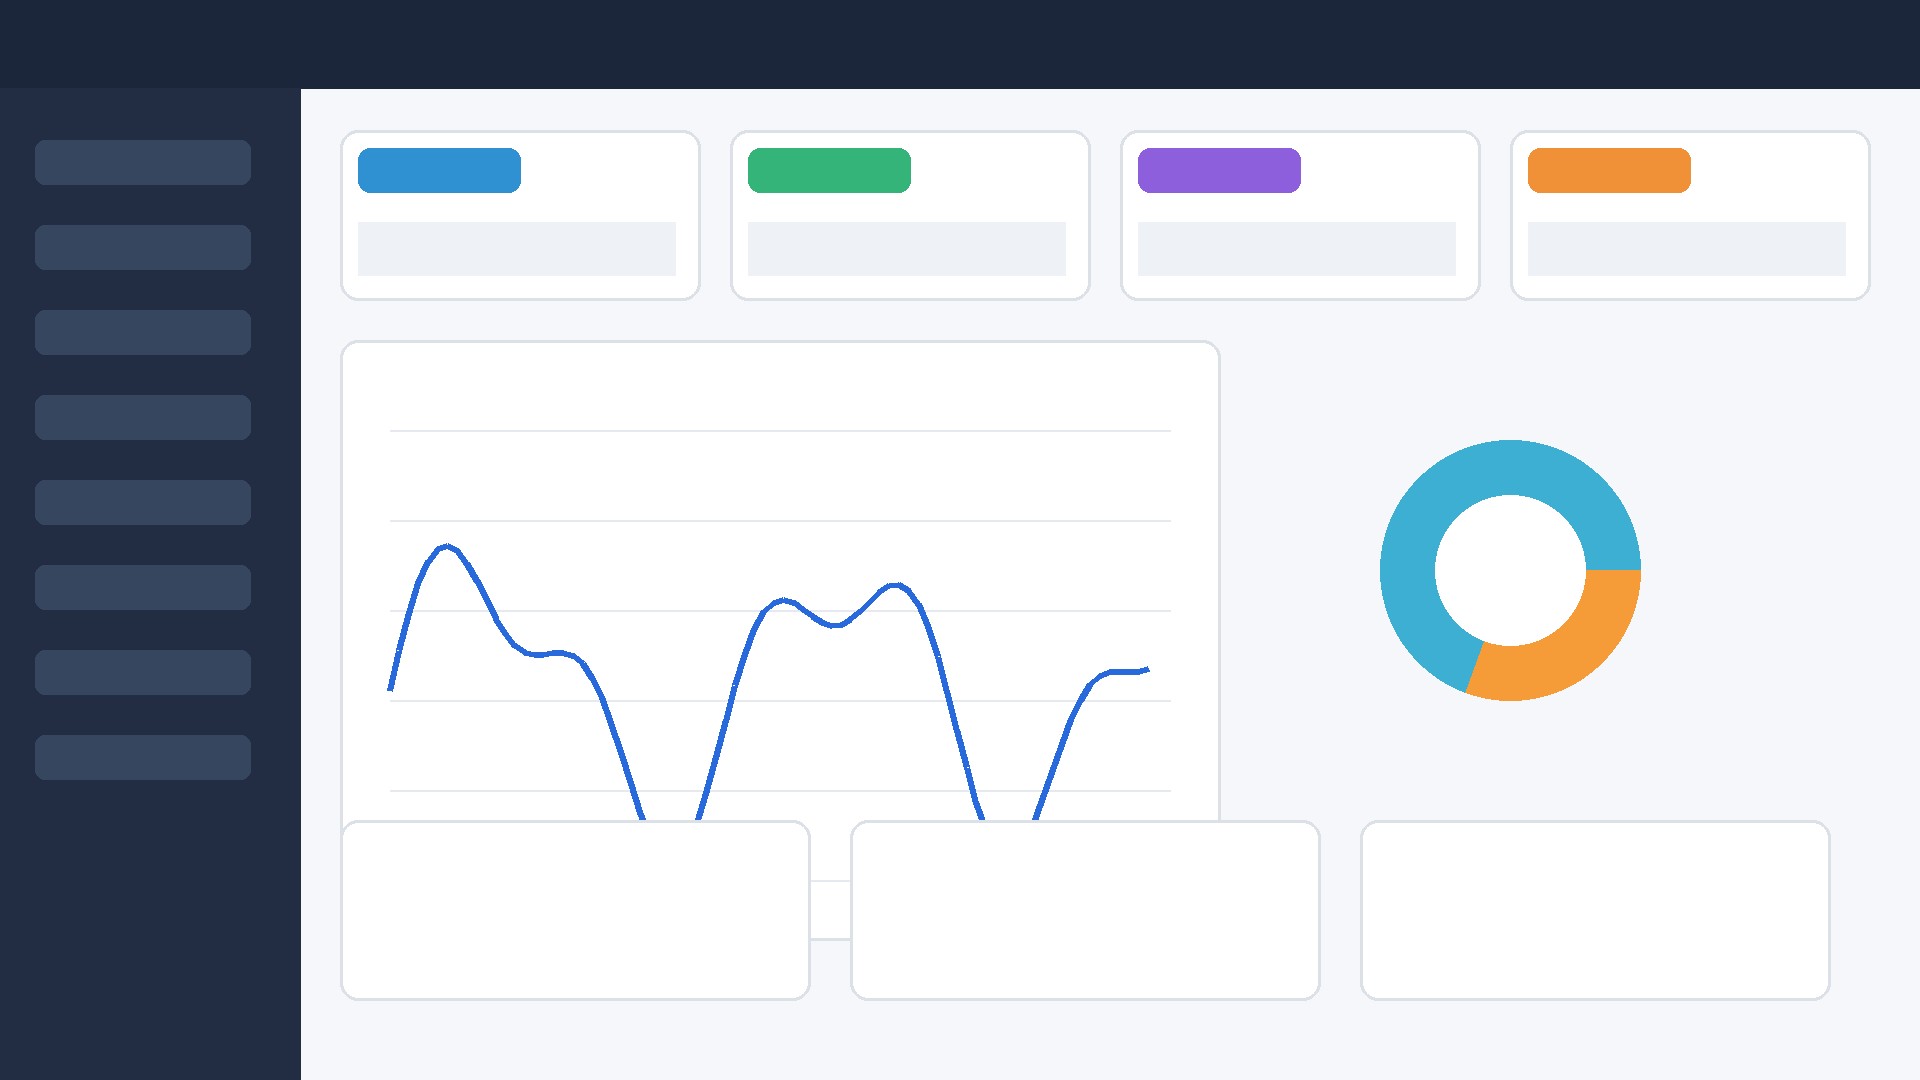
JPG Q90
106.5 KB
WebP results
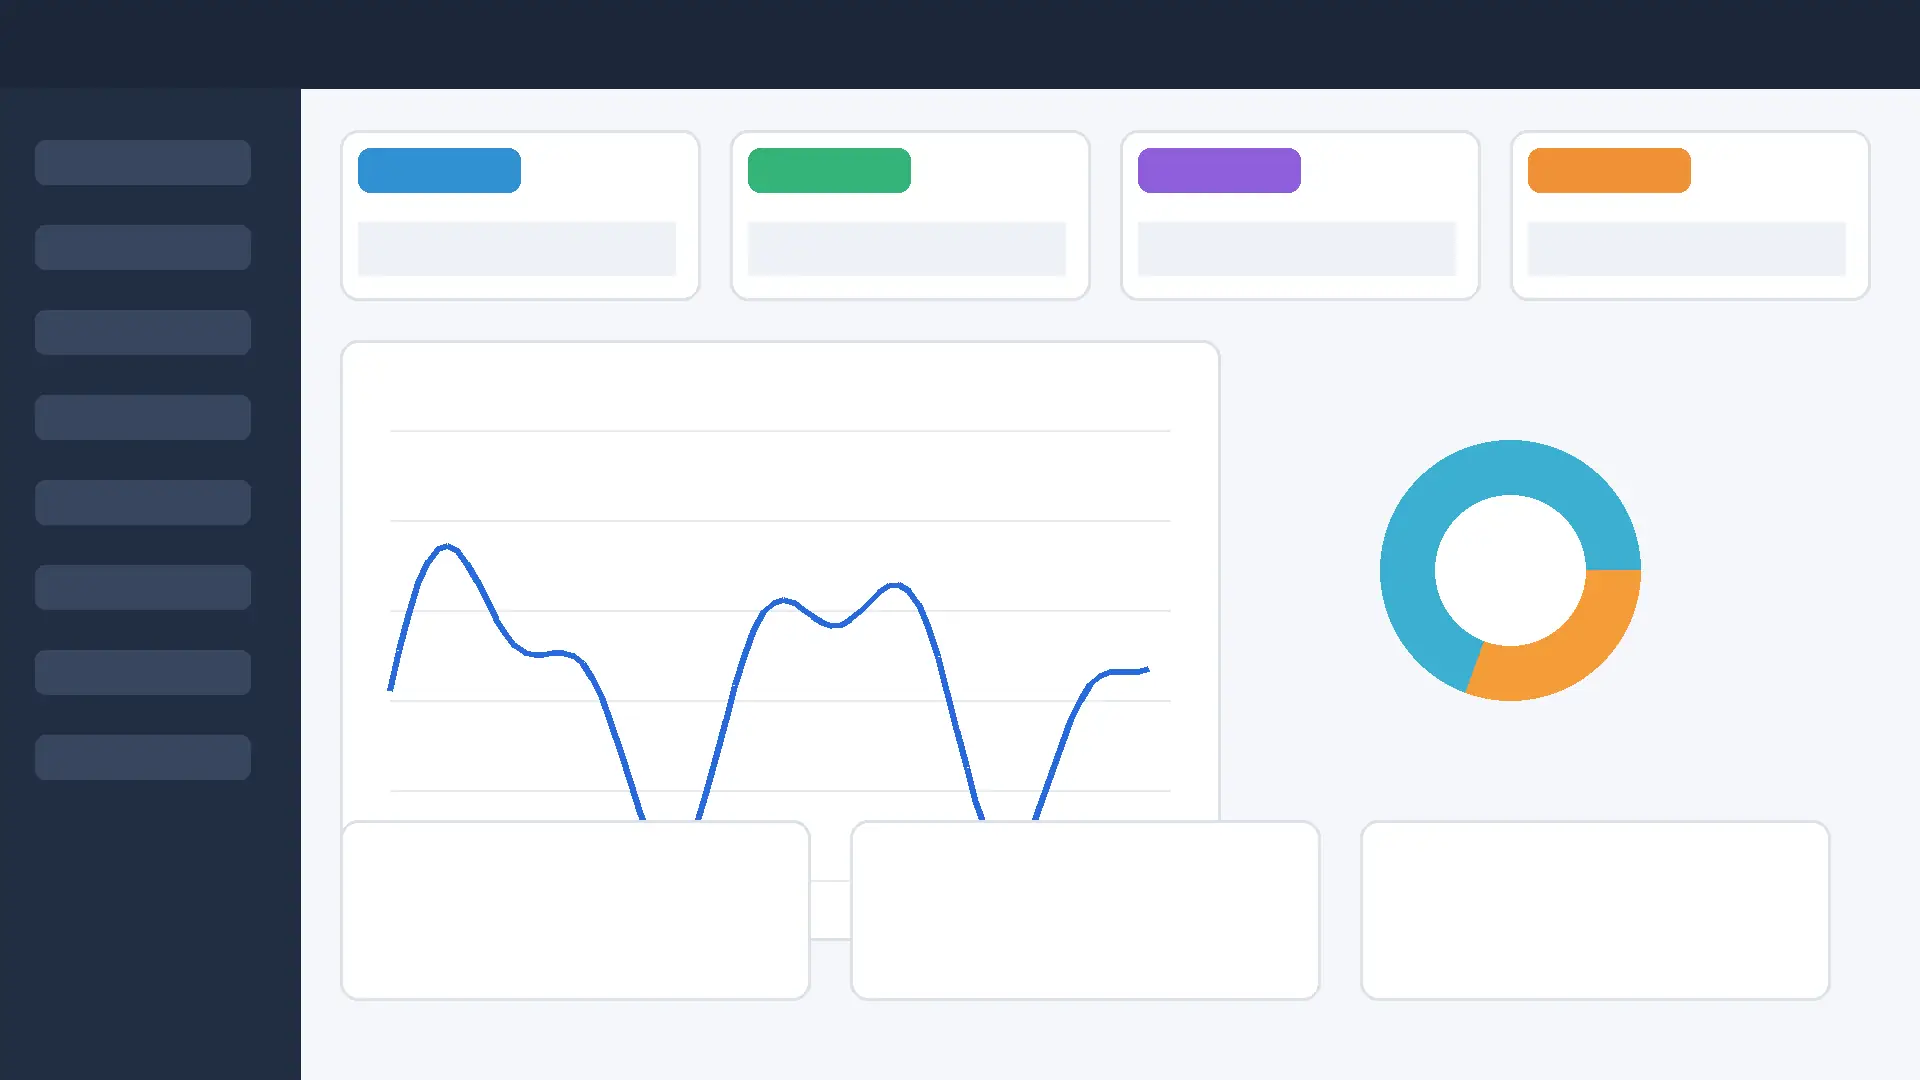
WebP Q70
17.8 KB
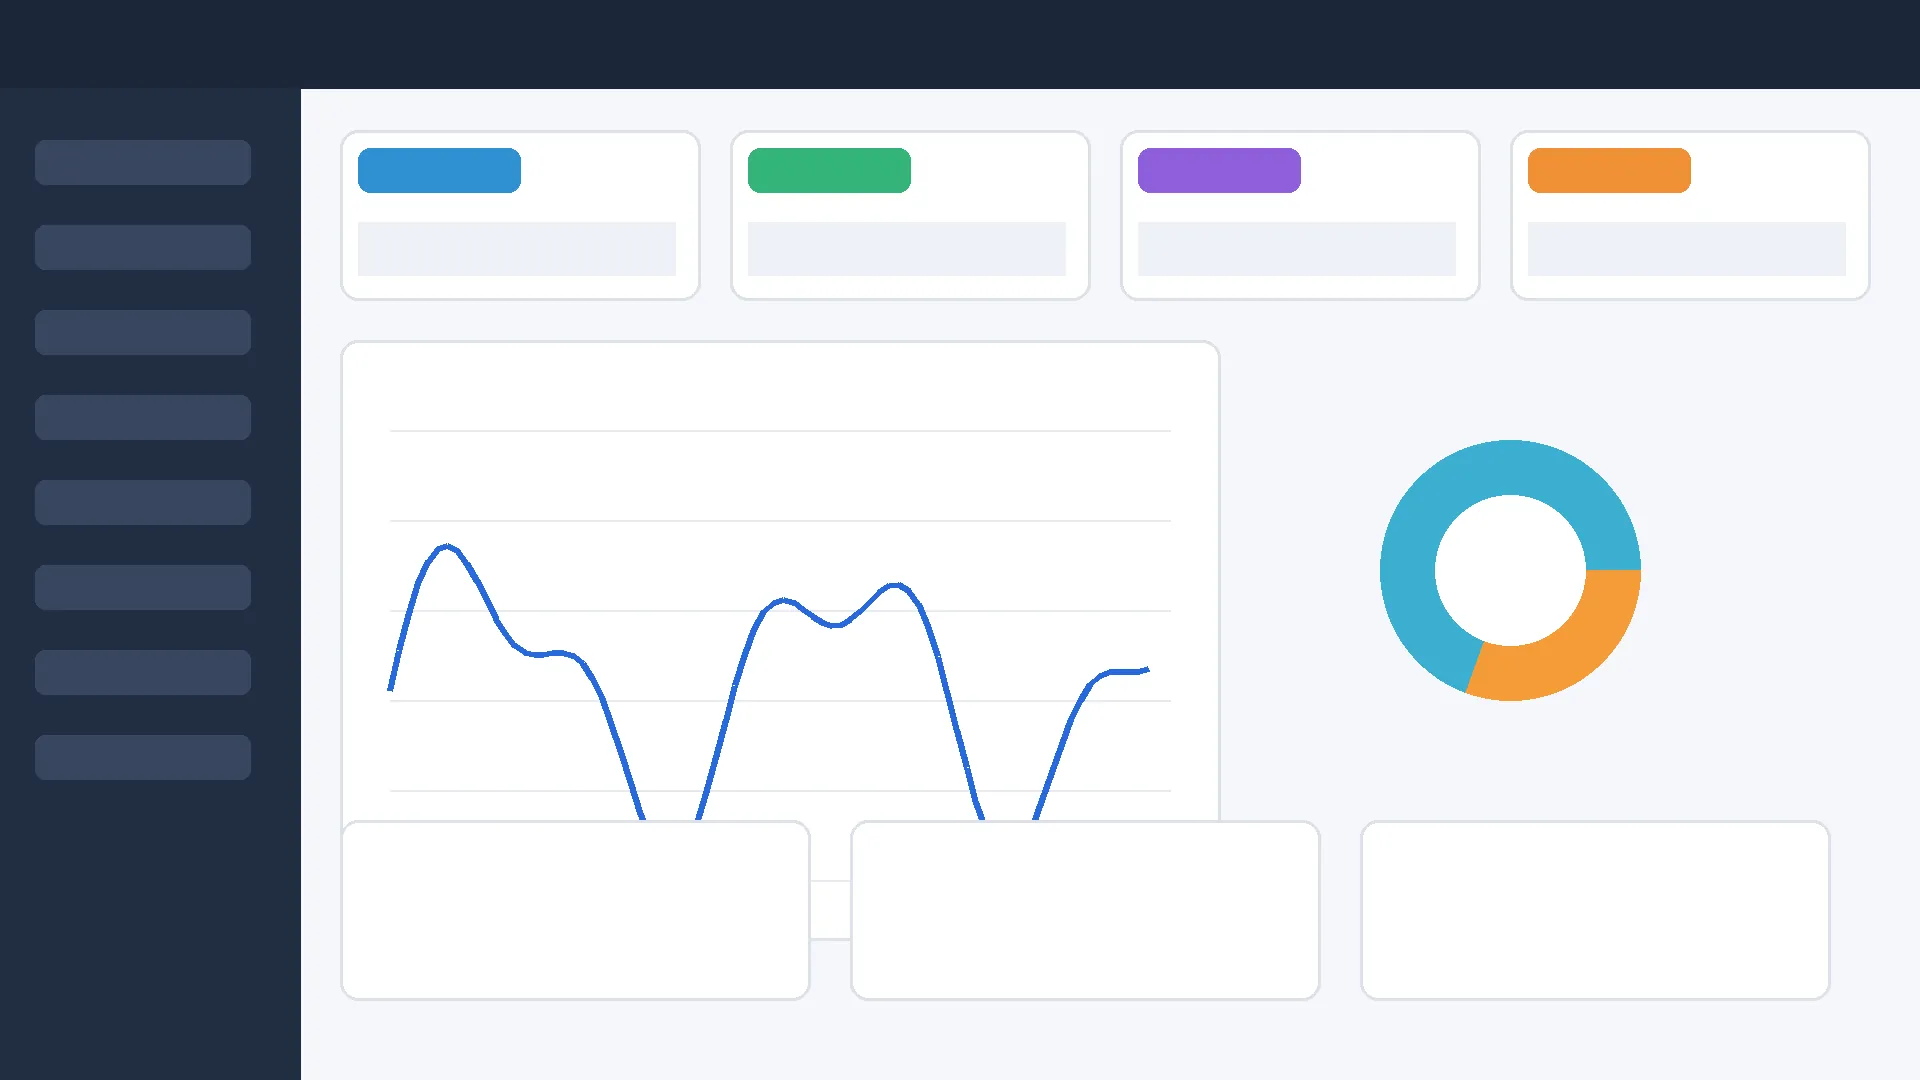
WebP Q80
20.2 KB
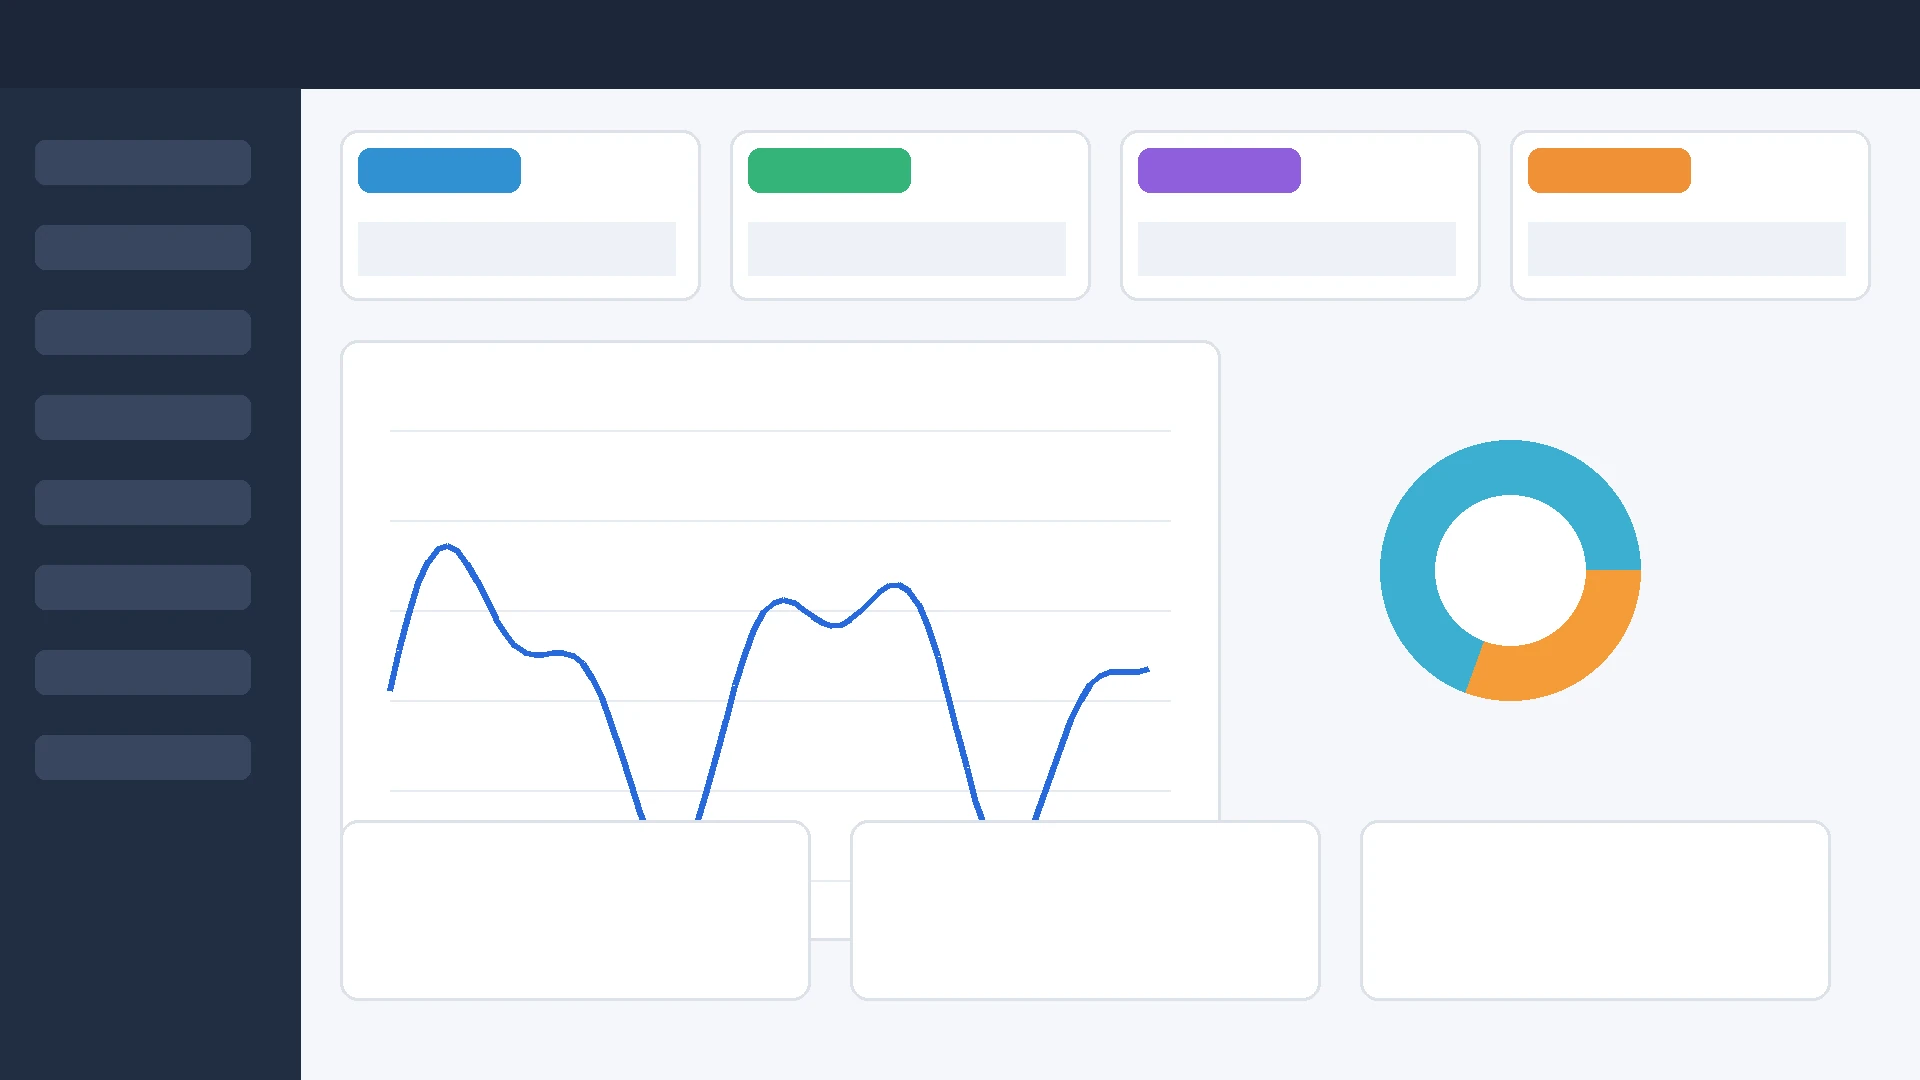
WebP Q90
26.4 KB
What happened?
Lowering the quality setting generally reduced the file size. However, the amount of reduction varied considerably between image types. The landscape image showed much larger changes in file size than the screenshot and graphic tests.
Graphic compression test
A 1600 × 1000 graphic containing flat colors, shapes, charts, and sharp edges.

Original
Source image
JPG results

JPG Q70
67.0 KB

JPG Q80
74.2 KB

JPG Q90
89.9 KB
WebP results

WebP Q70
12.6 KB

WebP Q80
14.6 KB

WebP Q90
17.4 KB
What happened?
Lowering the quality setting generally reduced the file size. However, the amount of reduction varied considerably between image types. The landscape image showed much larger changes in file size than the screenshot and graphic tests.
What the results tell us
Quality 90 is not always necessary
Higher quality settings produced larger files in all three tests. Depending on the image and intended use, reducing the quality setting can significantly reduce storage and bandwidth requirements.
WebP produced smaller files in these tests
WebP produced smaller files than JPG at every tested quality level for all three test images. The difference was particularly noticeable for the UI screenshot and graphic.
Image content matters
Compression results are not determined by the quality number alone. Photographs, screenshots, and graphics contain different visual information and therefore respond differently to compression.
What quality setting should you use?
There is no single quality setting that works best for every image. A practical approach is to compare the visual result at several quality levels and choose the lowest setting that still provides acceptable image quality.
| Quality | General idea | Possible use |
|---|---|---|
| 90 | Higher quality and larger files | Images where visual quality is important |
| 80 | Balanced quality and file size | General website images |
| 70 | Smaller files with more compression | Situations where bandwidth matters |
Try converting your own images
The best compression setting depends on your actual image. You can test different formats and compare the resulting files using our browser-based image conversion tools.